Evaluation metrics- Machine learning
- TECH BUDDY

- Jul 26, 2020
- 3 min read
After model building using a different algorithm, we can evaluate the performance of the model using different evaluation metrics. Building a predictive model is not your motive. It’s about creating and selecting a model that gives high accuracy on out of sample data. Hence, it is crucial to check the performance of your model prior to computing predicted values.
Different evaluation metrics are used depending upon types of problems.
Evaluation metrics for classification problem
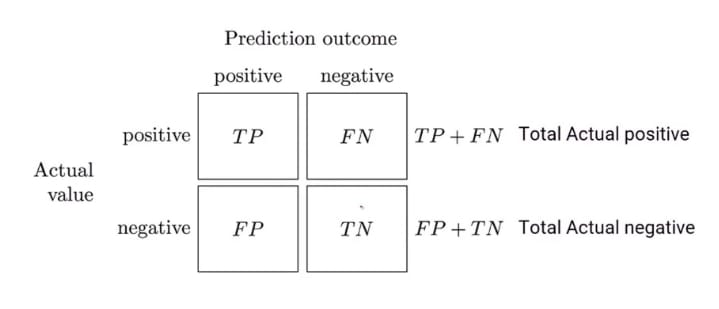
Confusion matrix:- A confusion matrix is a matrix of n X n matrix where n represents the number of classes in the variable. Consider an example of a titanic problem where the dependent variable survival has only two classes. so the confusion matrix will be in the form of a 2 X 2 matrix. Each row in the matrix represents the actual value and each column represents predicted values. Each cell has a specific meaning. since it is a classification problem it has only two values 0 and 1. First, consider the predicted value and then check against the actual value. After that, each cell can be named as true positive or negative, false positive or negative.
Accuracy:- It is the ratio of correct predicted values over the total predicted values.
Using accuracy as an evaluation metrics for imbalanced data is not a way to evaluate. Let us take an example of cancer test prediction out of 500, 4 people have tested positive, after creating a model predicted values of cancer positive come out to be 15, and accuracy comes out to be approx 97%. Also, consider a dumb model where every person has tested a negative, and accuracy comes out to be 98.8%. Using accuracy for evaluation metrics is not a great idea. There are different alternatives to accuracy that are present which can be used as an evaluation metrics FPR(false positive rate), TPR(True positive rate), FNR(false-negative rate).
Precision:- It is the ratio of actually predicted positive values to the total predicted positive. Let us understand with an example where we can use precision as evaluation metrics. Suppose you have given the task to find a criminal in a party where many reputed people are present. You can not declare VIP as a criminal person it will cause a problem in your job. Avoiding VIP is more preferred than catching a criminal. In this case, the false-positive rate is low, and the false-negative rate is high.
Recall:- It is the ratio of actually predicted positive values to the total actual positive. Consider an example where you can use recall as evaluation metrics. Suppose you are at the airport and passing through the metal detector and the main aim is to catch all weapon carriers. In this example catching weapons is more preferred than checking innocent. The false-positive rate is high and false negative is minimum. If there is a high recall in the model, then low precision and vice versa.
AUC-ROC:- AUC stands for the area under the curve and ROC stands for Receiver operating characteristic. It is widely used as evaluation metrics for binary classification. This metric gives a trade-off between true positives and false positives. After plotting the curve true positive rate against a false positive rate, more the area under the curve better will be the model.
Evaluation metrics for a
Regression problem
Root Mean Squared Error (RMSE):- RMSE is the most popular evaluation metric used in regression problems. It is used to find the error between predicted values and actual values. This metrics shows a large number of deviations
MSE metric is given by:
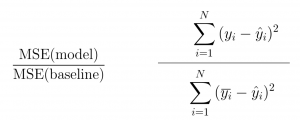
R-Squared:- When the RMSE decreases, the model’s performance will improve. But these values alone are not intuitive. RMSE metrics do not have a benchmark to compare. We can compare our model using this metric with a benchmark model. Lowe the R- squared value better will be the model. This is quite contradictory to higher values are better. Solution f this contradiction is adjusted R- squared
Adjusted R-Squared: By adding new features to the model, the R-Squared value either increases or remains the same. R-Squared does not penalize for adding features that add no value to the model.
k is a number of feature and n is a number of samples


Comments